
Embed from Getty Images
There were just two games in the NHL yesterday. The St. Louis Blues finally slew their first round demons, knocking the Blackhawks out. The Predators showed some resolve and managed to force a game seven with the Ducks on Wednesday.
Before we get started, here’s the game charts explainer:
A couple of notes on reading the charts:
- the Corsi differential is based on 5v5 play and is score-adjusted, as per war-on-ice.
- players at the top (with bars extending to the right) posted positive differentials (good)
- players at the bottom (and to the left) posted negative differentials (bad)
- the colour of each bar represents the player’s time on ice (see legend at the bottom)
- each players individual Corsi For attempts are included in parentheses
- a player with a strong C +/- but a (0) for iCF didn’t directly contribute to his strong showing.
- a player with a weak C +/- but a strong iCF score (i.e. greater than 5) may have been hindered by linemates. Maybe.
- like any reasonable person, I don’t believe that Corsi is everything. But it’s a very important part of the everything.
And now, on with the game charts…
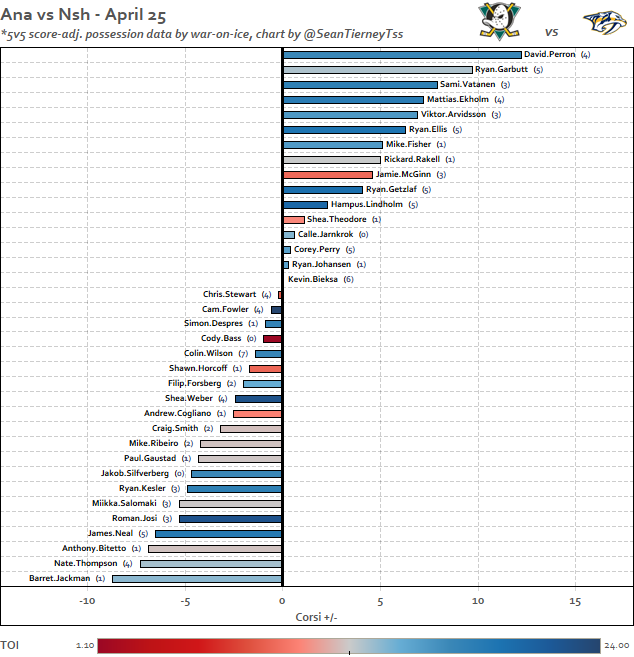
Perron and Garbutt led, Vatanen was near the top, and Ekholm and Arvidsson had good showings as well. There were no particularly strong iCF marks – several players tied with 5 each while remaining plus Corsi differential players overall.
At the bottom of the chart, Jackman was the game’s worst but was only ~-8. He wasn’t strong on the puck but this isn’t an awful score as these game charts go.
Interestingly, Wilson had the most iCF (7) but managed to finish with a negative Corsi differential. That’s some high-event play.
These teams meet again on Wednesday to settle this tight first-round matchup.
Series tied 3-3.
The Blues have suffered with a reputation as first-round chokers over the past few post-seasons. They changed all of that on Monday night by knocking out the Chicago Blackhawks earlier than they’ve been eliminated since 2008.
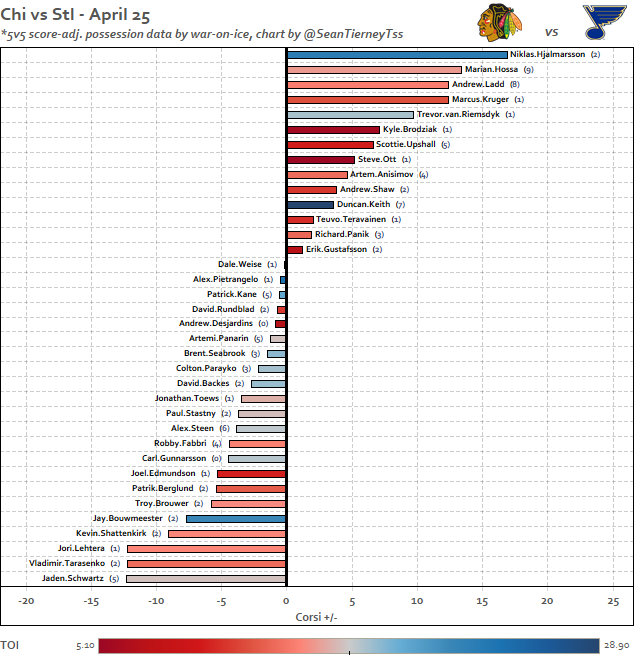
Hjalmarsson was the game’s best. Hossa, Ladd, Kruger, and TVR were strong as well. Hossa managed an excellent 9 iCF in the loss.
Despite their win, the Blues owned the bottom of the game chart. Schwartz, Tarasenko, and Lehtera each posted Corsi differentials in excess of -10, which is not a positive. Everything turned out rosy for the Blues in this one but they’ll need to avoid puck-chasing nights like this if they have designs to continue their playoff run.
Blues win series 4-3.
Series Corsi Differential

*click here for a larger view.
Usually I include this without much commentary but it’s worth noting here how excellent Hossa was at 5v5. He was the best…and it wasn’t close.
Brouwer, Stastny, and Bouwmeester will need better efforts going forward as well.
Read more…
NHL Playoffs Game Charts – Sunday, April 24
NHL Playoffs Game Charts – Saturday, April 23
Playoff Predictions using Corsi Differential and xGF%

2 thoughts on “NHL Playoffs Game Charts – Monday, April 25”